

Indian stock markets faced another challenging day on September 24, 2025. Volatility persisted. However, some sectors showed resilience. In this detailed analysis, we break down the performance of Nifty 50 and Bank Nifty. Moreover, we provide actionable trading strategies for the next session. First, let’s explore the key highlights. Additionally, we include technical indicators and sector insights to guide your decisions.
Key Takeaways
- Nifty 50 closed at 25,056.90, down 112.60 points or 0.45%.
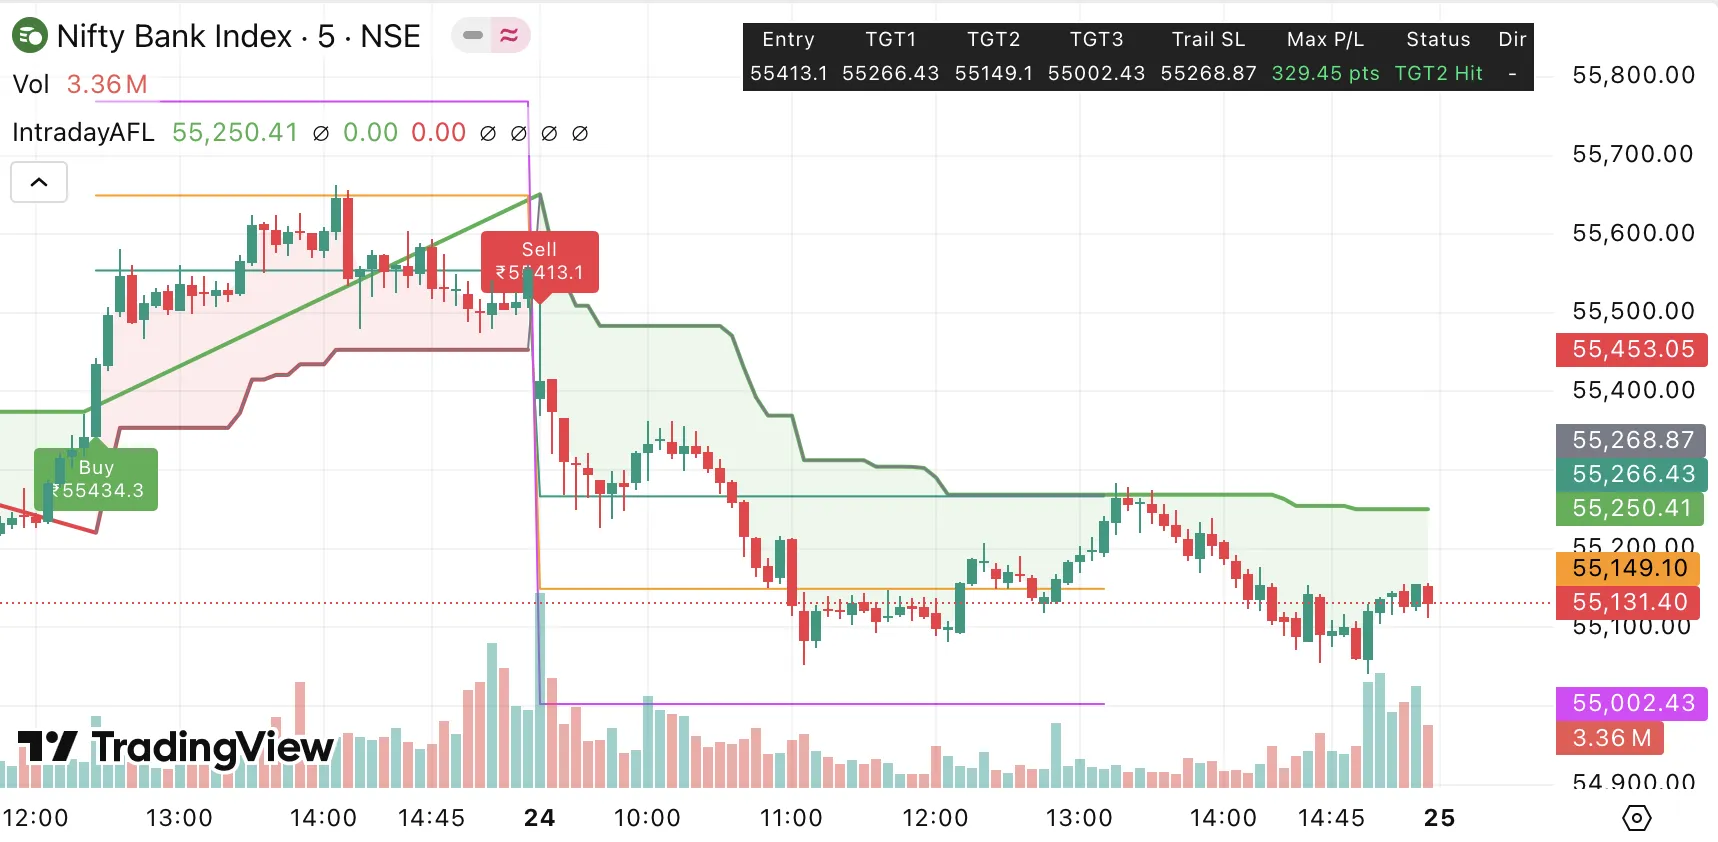
- Bank Nifty ended at 55,121.50, declining 388.25 points or 0.70%.
- FMCG sector bucked the trend, gaining 0.18%. However, Realty and Auto sectors fell sharply.
- Global markets were mixed; Asian indices rebounded while US stocks dipped.
- India VIX rose slightly to 10.58, indicating low volatility.
- PCR ratio for Nifty stood at 0.78, suggesting bearish sentiment.
- Key support for Nifty at 25,000; resistance at 25,150.
- For intraday trading on 25/09/25, focus on breakout levels.
- Swing traders should watch for trend reversals above 25,200.
- Check our Free Buy-Sell Chart for real-time signals.
These points summarize the day’s action. Now, let’s delve deeper into the price movements. Additionally, we will cover global influences.
Price Action Breakdown (Nifty and Bank Nifty)
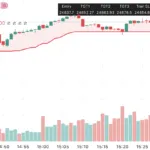
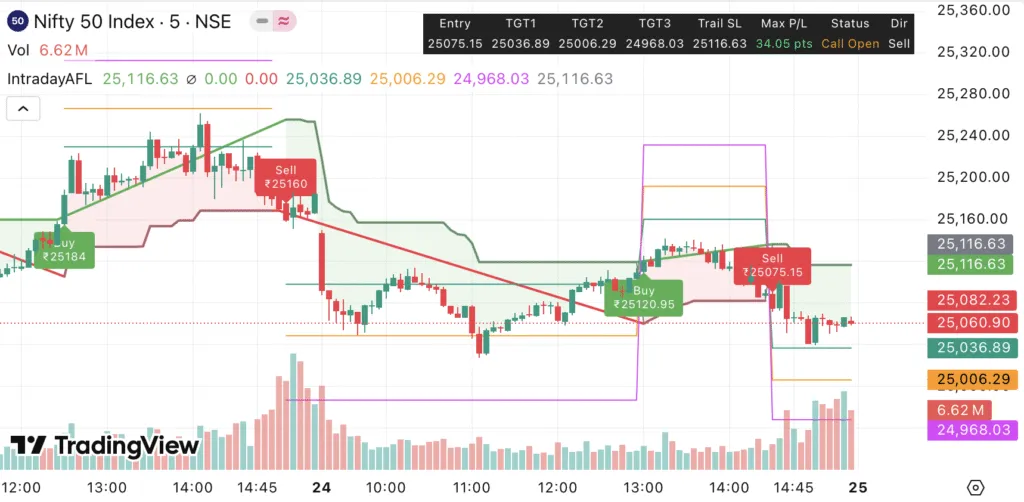
The market opened weakly on September 24, 2025. Nifty 50 started at 25,169.50 but faced selling pressure early on. It dipped to an intraday low of 25,027 before a mild recovery. However, bears dominated the close. The index formed a doji candle, signaling indecision. Moreover, it tested the 20-day EMA support at 25,042 but held above it.
Trading volume was lower by 10% compared to the previous day. This indicates reduced participation. Additionally, the advance-decline ratio was 0.62, with more decliners than advancers. Top losers included Tata Motors (down 2.6%) and Bharat Electronics (down 2.3%). On the positive side, Power Grid and Hindustan Unilever gained over 1%.
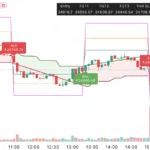
Shifting to Bank Nifty, it opened at 55,387.10 but slipped to 55,040.45. The index closed down 0.70%, underperforming Nifty. Heavyweights like HDFC Bank (down 0.90%) and ICICI Bank (down 0.92%) dragged it lower. However, AU Small Finance Bank rose 1.32%. The index broke below its 50-day EMA at 55,190, hinting at weakness.
Overall, both indices showed volatility with intraday swings. For instance, Nifty recovered 100 points from its low but couldn’t sustain. This pattern suggests caution. Moreover, broader markets like Midcap 100 fell 0.98%. Now, let’s examine global factors influencing this.
To enhance your analysis, use our TradingView Indicator for advanced charts. It provides real-time insights. Additionally, external factors played a role, as we discuss next.
Global Market and Macro Updates
Global cues were mixed on September 24, 2025. In Asia, Hang Seng rose 1% amid AI enthusiasm in China. Alibaba surged 9% after launching a new AI model. However, Kospi fell 0.4%. European stocks showed weakness, down slightly.
In the US, markets dipped after Fed Chair Jerome Powell’s comments. He highlighted a balancing act between inflation and jobs. The Nasdaq fell nearly 1%, with Nvidia down 2.8%. S&P 500 dropped 0.6%. Traders now see a 95% chance of a rate cut in October.
Macro updates included India’s rupee gaining 6 paise to 88.69 against the dollar. This was driven by domestic bank sales. However, FII outflows continued at Rs 3,551 crore. DIIs bought Rs 2,671 crore, providing support.
Geopolitical tensions and US-India trade concerns weighed in. For example, H-1B visa fee hikes hurt IT stocks. Additionally, GST rationalization and a positive monsoon offered some optimism. But trade rhetoric offset this.
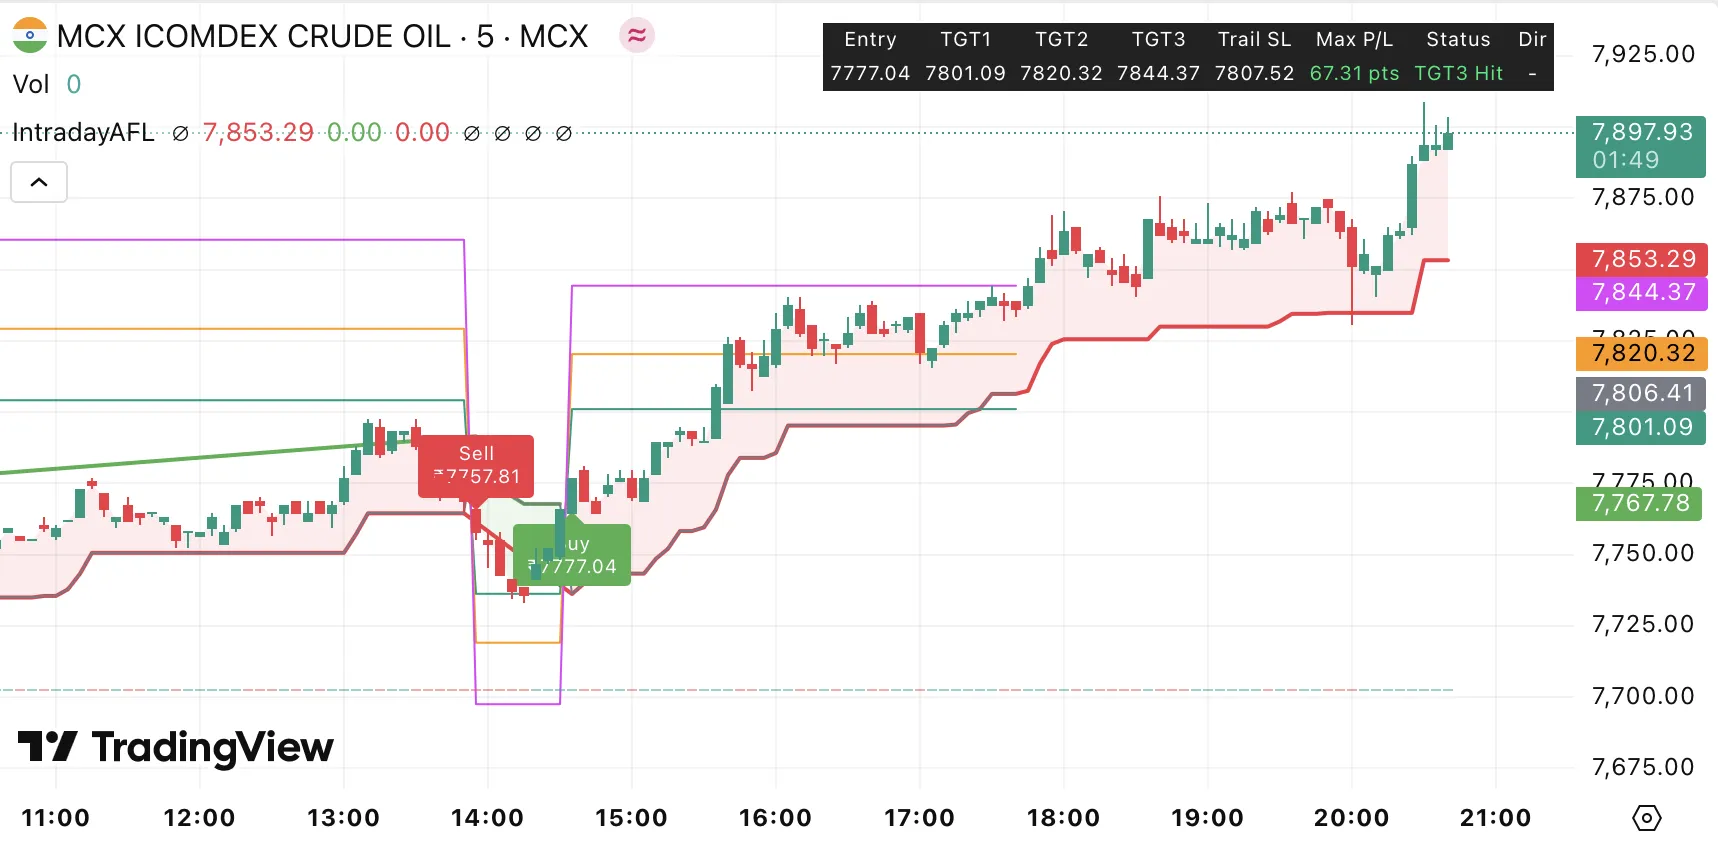
Oil prices were stable, with Brent at $73 per barrel. Gold dropped after a rally. These factors influenced sentiment. Now, transitioning to technicals, let’s look at key indicators.
For more on global trends, refer to Reuters Markets. It offers reliable updates. Moreover, local data from NSE India confirms these trends.
Technical Indicator Table (RSI, VIX, PCR)
| Indicator | Nifty 50 | Bank Nifty | Remarks |
|---|---|---|---|
| RSI (14-day) | 52 | 51 | Bearish crossover; weakening momentum. |
| India VIX | 10.58 | N/A | Low volatility; up from 10.57. |
| PCR Ratio (OI) | 0.78 | 0.81 | Bearish sentiment; puts dominate. |
This table highlights neutral to bearish signals. For instance, RSI below 60 suggests fading bullish momentum. However, VIX remains low, indicating stability. Additionally, PCR below 1 points to caution. Now, let’s review sector performances.
Sector Performance Table
| Sector | Change (%) | Top Gainers | Top Losers |
|---|---|---|---|
| FMCG | +0.18 | HUL (+1.2%), Nestle (+0.9%) | None significant |
| Realty | -2.5 | None | Godrej Properties (-3%) |
| Auto | -1.15 | None | Tata Motors (-2.6%), Hero Moto (-1.8%) |
| IT | -0.67 | None | Tech Mahindra (-1.25%), Wipro (-2%) |
| Private Bank | -0.8 | AU Small Finance (+1.32%) | IndusInd (-1.41%) |
FMCG was the only gainer, thanks to defensive buying. However, Realty led losses amid profit booking. Additionally, IT suffered from H-1B visa concerns. For sector-specific strategies, join our Hero Zero Option Calls for 2-5X profits. Now, onto trading strategies.
Trading Strategy for 25/09/25 (Intraday + Swing)
For intraday trading on September 25, 2025, focus on key levels. First, watch Nifty’s support at 25,000. If it holds, buy for targets of 25,150. However, a break below could lead to 24,800. Use stop-loss at 24,950. Moreover, for Bank Nifty, resistance is at 55,500. Sell on rallies if it fails to break.
Intraday setup: Go long on Nifty above 25,100 with target 25,200. Short below 25,000 aiming for 24,900. Additionally, monitor volume spikes. For options, consider bull put spreads if PCR improves.
For swing trading, the outlook is cautious. Hold longs if Nifty closes above 25,200. Target 25,500 in 3-5 days. However, if it slips below 24,900, shift to shorts for 24,500. Bank Nifty swings: Buy above 55,600 for 56,000. Sell below 55,000 targeting 54,500.
Risk management is key. Use 1% risk per trade. Additionally, factor in global cues like US futures. For live signals, check our Free Buy-Sell Chart. Moreover, outbound insights from Moneycontrol can help.
Key Levels Table
| Index | Support 1 | Support 2 | Resistance 1 | Resistance 2 |
|---|---|---|---|---|
| Nifty 50 | 25,000 | 24,800 | 25,150 | 25,262 |
| Bank Nifty | 55,000 | 54,500 | 55,500 | 55,660 |
These levels are crucial for tomorrow. For example, Nifty’s 25,000 is a strong support. However, breaking it could accelerate selling. Additionally, use our TradingView Indicator to visualize them.
Final Thoughts
The market on September 24, 2025, reflected caution amid global uncertainties. However, supports held firm. Moreover, defensive sectors like FMCG provided stability. Looking ahead, watch for breakouts on 25/09/25. Additionally, economic data could influence trends. Stay informed with reliable sources like NSE India. For high-reward options, explore Hero Zero Option Calls. Trade wisely.
Disclaimer
This analysis is for informational purposes only. It does not constitute financial advice. Moreover, past performance is not indicative of future results. Consult a professional advisor before trading. Additionally, market risks are involved, and capital loss is possible.